Collecting Environmental Sensor Data with SDR, Grometheus, and Grafana
Summary
Although I explored a design for a custom humidity and temperature sensor, here I describe the solution I ultimately ended up withen and which I would recommend to anyone looking to implement such a system.
This article discusses the use of cheap acurite sensors which transmit there measurements on 433MHz ISM band which can be easily picked up with a cheap RTL-SDR device, and the setup of prometheus for data capture as well as the [monitor_rtl433]((https://github.com/mcbridejc/monitor_rtl433) utility I created to act as a bridge between the SDR and Prometheus.
The sensors
There are a number of options for sensors on the market. I've used these two with success. They have worked reliably, and they each come with a unique serial number so you can add as many as you want to your system and still differentiate between them.
The AcuRite 06044 is an indoor only model with display:

The AcuRite 06002M is an indoor/outdoor model without a display:

There are other devices supported by rtl_433. Any of those should be easy to set up too.
Other hardware
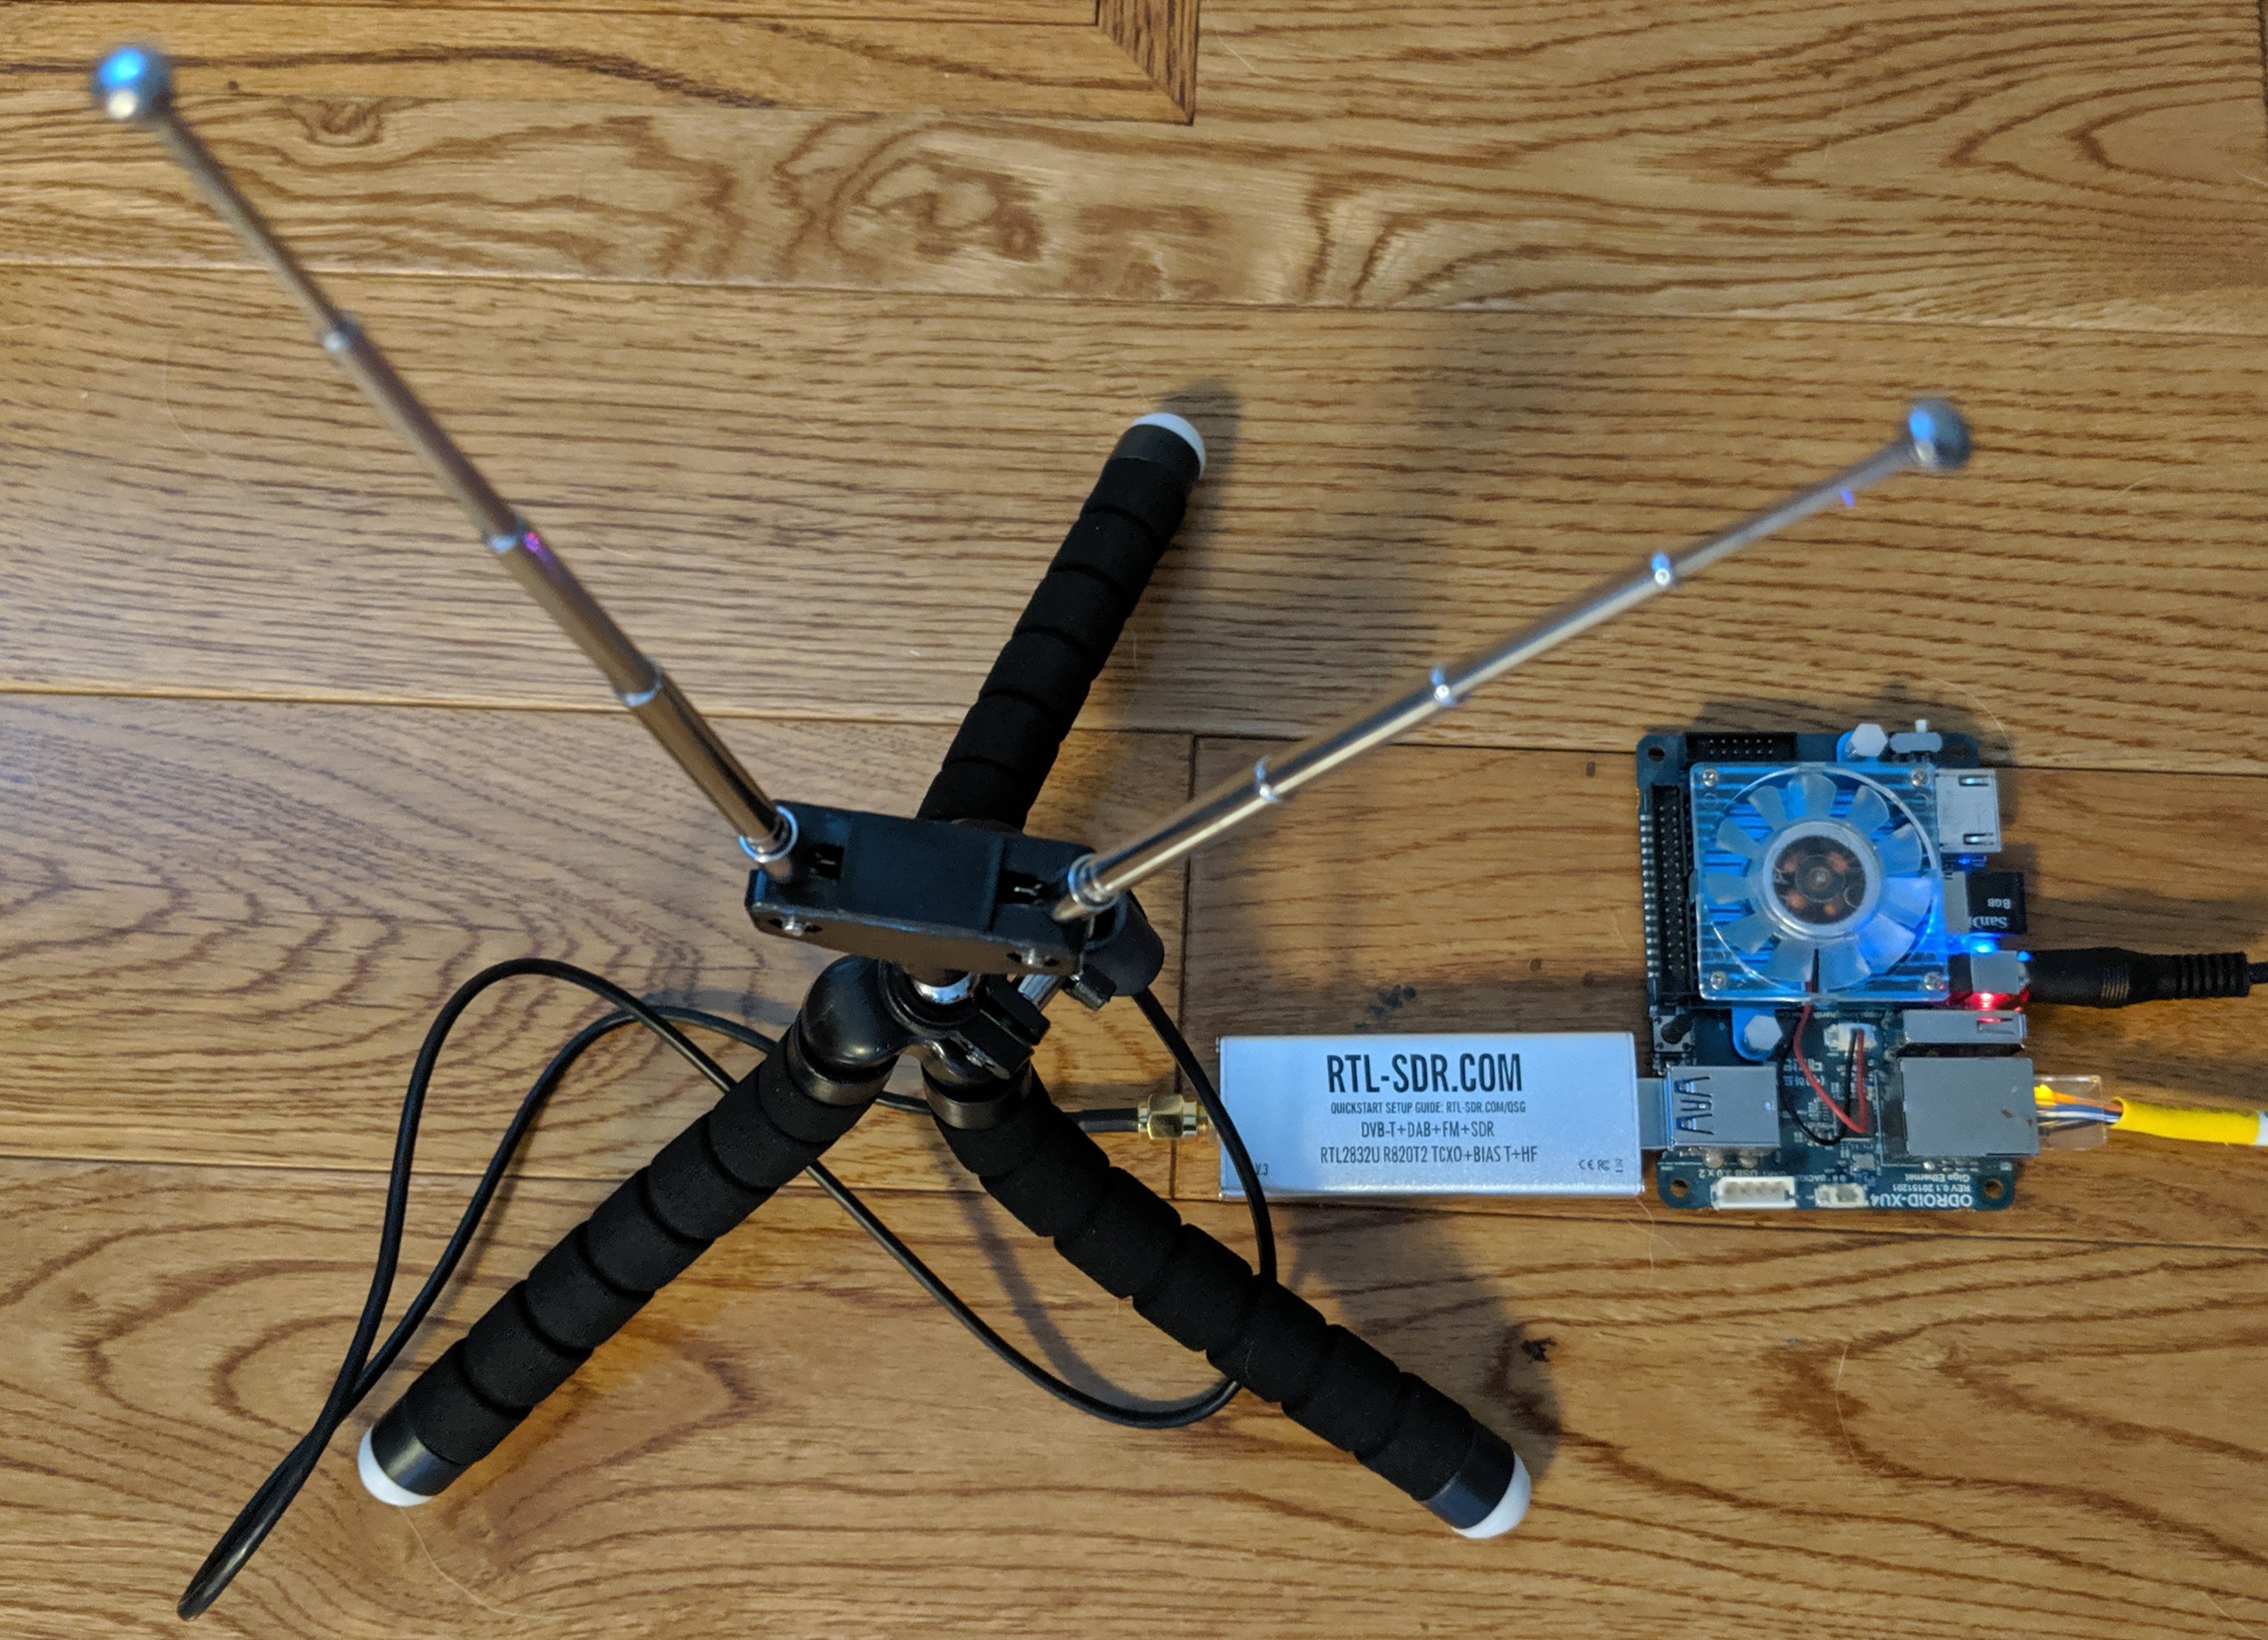
To receive the signals, I used an RTL-SDR plugged into an odroid single board computer; a raspberry PI would also work just fine here, as would any other SBC that can run linux.
Setting up Linux
We're going to setup a few services now:
- Prometheus is a time series database.
- Grafana is a dashboard/plotting package that will pull data from prometheus and display it in your browser.
- monitor_rtl433 is a simple daemon I created to read the sensor data from the SDR and provide the stats for prometheus
I'll give a quick run-down of how I installed these, but I also recommend checking out the documentation for the projects or other tutorials specific to that if you run into trouble or want to adapt your methods a bit.
Setting up prometheus
Prometheus has binaries for arm7, available for download here. To install, just download the arm7 tarball and extract:
wget https://github.com/prometheus/prometheus/releases/download/v2.25.2/prometheus-2.25.2.linux-armv7.tar.gz
tar -xvzf prometheus-2.25.2.linux-armv7.tar.gz
mv prometheus-2.25.2.linux-armv7 prometheus
Then create a configuration for prometheus, to tell it where to scrape input data from. Here's my configuration as an example:
## prometheus.yml
# my global config
global:
  scrape_interval:     15s # Set the scrape interval to every 15 seconds. Default is every 1 minute.
  evaluation_interval: 15s # Evaluate rules every 15 seconds. The default is every 1 minute.
  # scrape_timeout is set to the global default (10s).

# Alertmanager configuration
alerting:
  alertmanagers:
  - static_configs:
    - targets:
      # - alertmanager:9093

# A scrape configuration containing exactly one endpoint to scrape:
# Here it's Prometheus itself.
scrape_configs:
  # The job name is added as a label `job=<job_name>` to any timeseries scraped from this config.
  - job_name: 'prometheus'

    # metrics_path defaults to '/metrics'
    # scheme defaults to 'http'.

    static_configs:
    - targets: ['localhost:9090']

  - job_name: 'monitor433'
    scrape_interval: 10s
    static_configs:
    - targets: ['localhost:5000']
The most important bit is the 'monitor433' scrape config job, as this tells prometheus to scape from
http://localhost:5000/metrics, which is where the python `monitor433' process we'll be setting up
shortly will be listening.
Installing grafana
Grafana also has a stand-alone arm binaries release, which can be found here, and which can be installed much the same way into your home directory:
wget https://dl.grafana.com/oss/release/grafana-7.4.5.linux-armv6.tar.gz
tar -zxvf grafana-7.4.5.linux-armv6.tar.gz
mv grafana-7.4.5.linux-armv6 grafana
Grafana configuration is stored in grafana/conf/grafana.ini. I'll leave any setup for grafana to
the reader, because, to be honest, it has been a while since I set it up and I don't know what I had
to change. It may be that the default config is fine and you can do all of the setup in the grafana
GUI. Check out the setup instructions here: https://prometheus.io/docs/visualization/grafana/.
Install rtl_433
You'll need the rtl_433 utility installed. There are instructions for building
here. I built it from source
with cmake. You may be able to install from a package depending on your distribution, e.g. with
ubuntu sudo apt install rtl-433.
Identifying your devices
Once rtl_433 is installed, and your SDR is plugged in, you can run rtl_433 -F json to get a live stream of events detected. It should look something like this:
# rtl_433 -F json
rtl_433 version 19.08-18-g8eecdbb branch master at 201909241811 inputs file rtl_tcp RTL-SDR
Use -h for usage help and see https://triq.org/ for documentation.
Trying conf file at "rtl_433.conf"...
Trying conf file at "/root/.config/rtl_433/rtl_433.conf"...
Trying conf file at "/usr/local/etc/rtl_433/rtl_433.conf"...
Trying conf file at "/etc/rtl_433/rtl_433.conf"...

    Consider using "-M newmodel" to transition to new model keys. This will become the default someday.
    A table of changes and discussion is at https://github.com/merbanan/rtl_433/pull/986.

Registered 108 out of 138 device decoding protocols [ 1-4 8 11-12 15-17 19-21 23 25-26 29-36 38-60 63 67-71 73-100 102-103 108-116 119 121 124-128 131-138 ]
Found Rafael Micro R820T tuner
Exact sample rate is: 250000.000414 Hz
[R82XX] PLL not locked!
Sample rate set to 250000 S/s.
Tuner gain set to Auto.
Tuned to 433.920MHz.
{"time" : "2021-03-25 03:27:05", "model" : "LaCrosse TX141TH-Bv2 sensor", "id" : 71, "channel" : 0, "battery" : "OK", "temperature_C" : 11.100, "humidity" : 75, "test" : "No"}
{"time" : "2021-03-25 03:27:06", "model" : "Acurite tower sensor", "id" : 15922, "channel" : "A", "battery_low" : 0, "temperature_C" : 20.800, "humidity" : 46}
{"time" : "2021-03-25 03:27:06", "model" : "Acurite tower sensor", "id" : 15922, "channel" : "A", "battery_low" : 0, "temperature_C" : 20.800, "humidity" : 46}
{"time" : "2021-03-25 03:27:06", "model" : "Acurite tower sensor", "id" : 15922, "channel" : "A", "battery_low" : 0, "temperature_C" : 20.800, "humidity" : 46}
{"time" : "2021-03-25 03:27:07", "model" : "Acurite 606TX Sensor", "id" : 43, "battery" : "OK", "temperature_C" : 9.300, "mic" : "CHECKSUM"}
{"time" : "2021-03-25 03:27:10", "model" : "Acurite tower sensor", "id" : 15352, "channel" : "B", "battery_low" : 0, "temperature_C" : 7.700, "humidity" : 88}
{"time" : "2021-03-25 03:27:10", "model" : "Acurite tower sensor", "id" : 15352, "channel" : "B", "battery_low" : 0, "temperature_C" : 7.700, "humidity" : 88}
{"time" : "2021-03-25 03:27:10", "model" : "Acurite tower sensor", "id" : 15352, "channel" : "B", "battery_low" : 0, "temperature_C" : 7.700, "humidity" : 88}
Now your task is to identify which sensor is which, and how difficult this is will depend on how many sensors you and your neighbors have. One trick is to switch the "channel" on a sensor of interest between A and B, and watch for one of the "id" numbers to change accordingly. Or, just power on and off a sensor and watch for it to start and stop. For some sensors, there is an LED which blinks each time it transmits an update, and it's possible to visually correlate this with the updates on the terminal. Once I figure out the ID number of a sensor, I usually write it on the back of the sensor for next time.
Setting up monitor_rtl433
You can checkout the monitor project from
https://github.com/mcbridejc/monitor_rtl433. This
utility is a little python daemon I wrote to spawn an rtl_433 process, and run a webserver to make
make collected data available. In order to define exactly what goes into the /metrics route
scraped by prometheus, you will need to write a little custom python.
For an example, see examples/main.py.
Basically, you need to create a python object, derived from MetricFilter for each sensor you want
to collect data from. The process method on this class takes a dict created from the json blob
returned by rtl_433, and maps it to Metric objects which are provided to prometheus. This
translation is necessary because the format of the JSON data varies for different sensor types.
Here's an example of the MetricFilter class that works for both types of acurite sensor:
class AcuriteTower(MetricFilter):
    def __init__(self, id):
        self.id = id
        # The `_match` property will be used to determine which sensor records
        # this filter will be applied to
        self._match = {"model": "Acurite tower sensor", "id" : self.id}

    def process(self, r):
        """Takes a single sensor record, and converts it to 0 or more metrics
        """
        sensor_id = "%s%s" % (str(self.id), r['channel'])
        yield Metric('temperature', degc2f(r['temperature_C']), labels={'sensor_id': sensor_id})
        yield Metric('humidity', r['humidity'], labels={'sensor_id': sensor_id})
        yield Metric('battery_warning', r['battery_low'], labels={'sensor_id': sensor_id})
In the constructor, it sets the _match variable to a dict. This filter will be used to process any
incoming data that matches all of the key/value pairs provided here. In this case, that means any
records where "model" is "Acurite tower sensor" and "id" is the provided number.
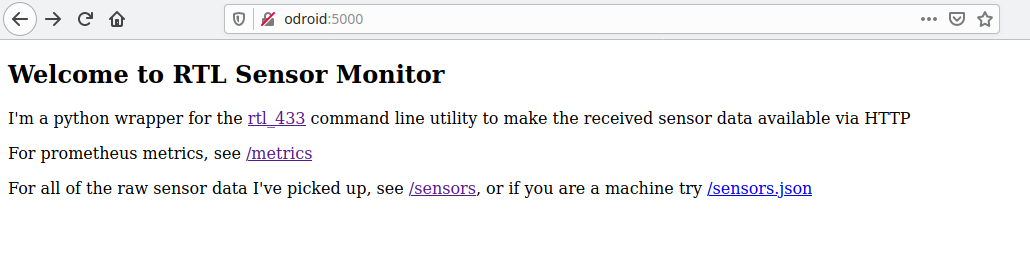
Once you create your own script based on the example main.py, you can run that and point your web browser at port 5000.
Here, you'll get a landing page showing some options:
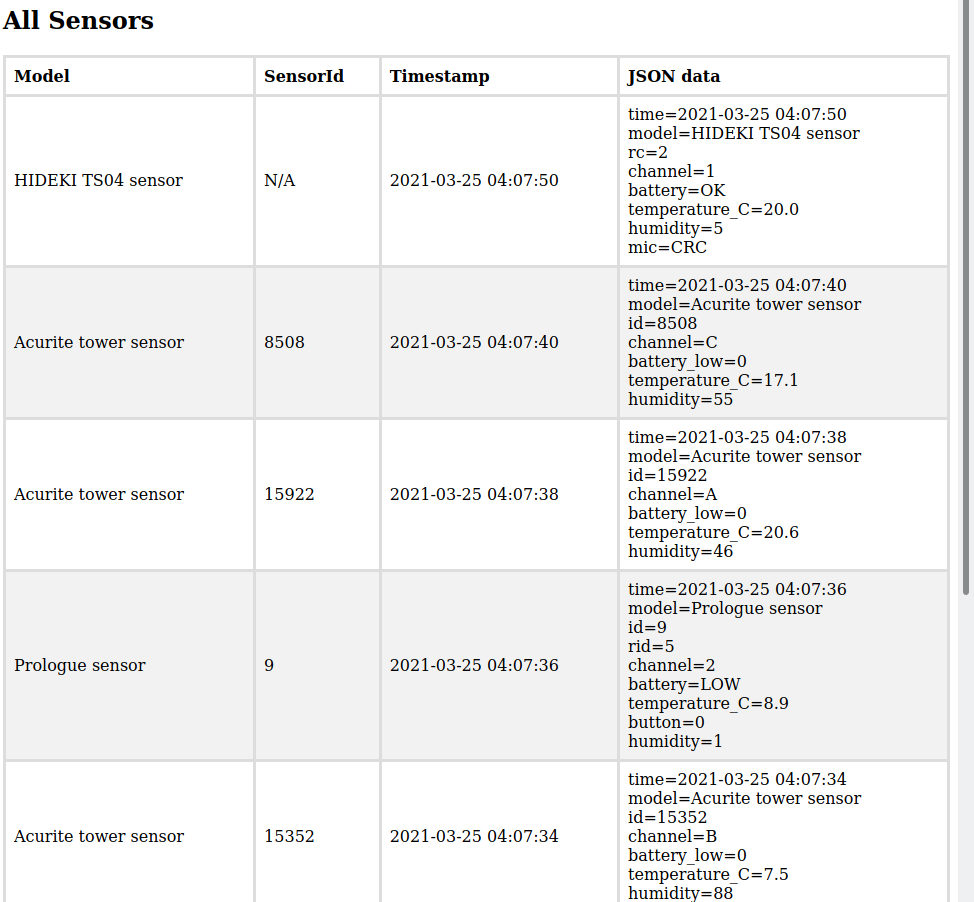
If you follow the sensors link, you'll get a table with the most recent update from all of the sensors it has seen since it was started. If you live around other people, you'll probably see a lot of sensors here. Other's weather sensors, tire pressure sensors, alarm system sensors, etc.
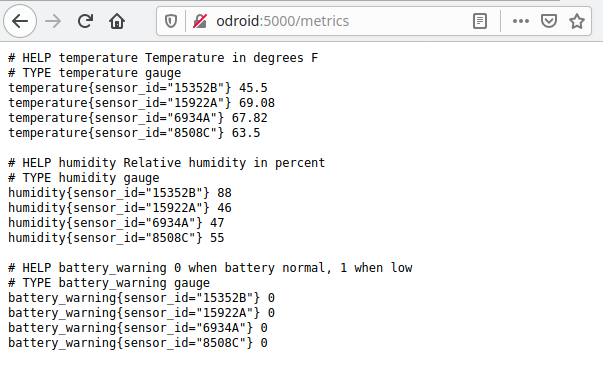
The most important thing to make sure you are setup correctly for prometheus, is to make sure that
you get the expected metrics under the /metrics link. It should look something like this:
Configure services
In order to make sure your three new services are automatically started at boot, you can add them as systemd services.
Here are my service definition files, which are stored in /etc/systemd/system.
[Unit]
Description=Prometheus time series database

[Service]
Type=simple
WorkingDirectory=/root/prometheus
ExecStart=/root/prometheus/prometheus --config.file=prometheus.yml

[Install]
WantedBy=multi-user.target
[Unit]
Description=Grafana server

[Service]
Type=simple
WorkingDirectory=/root/grafana
ExecStart=/root/grafana/bin/grafana-server -config conf/grafana.ini

[Install]
WantedBy=multi-user.target
[Unit]
Description=433MHz sensor monitor

[Service]
Type=simple
Environment=MONITOR_RTL433_HOST="0.0.0.0"
ExecStart=/usr/bin/python3 /root/monitor433.py

[Install]
WantedBy=multi-user.target
To make sure these services are started at boot, you may need to run these commands:
sudo systemctl enable grafana.service
sudo systemctl enable prometheus.service
sudo systemctl enable monitor_rtl433.service
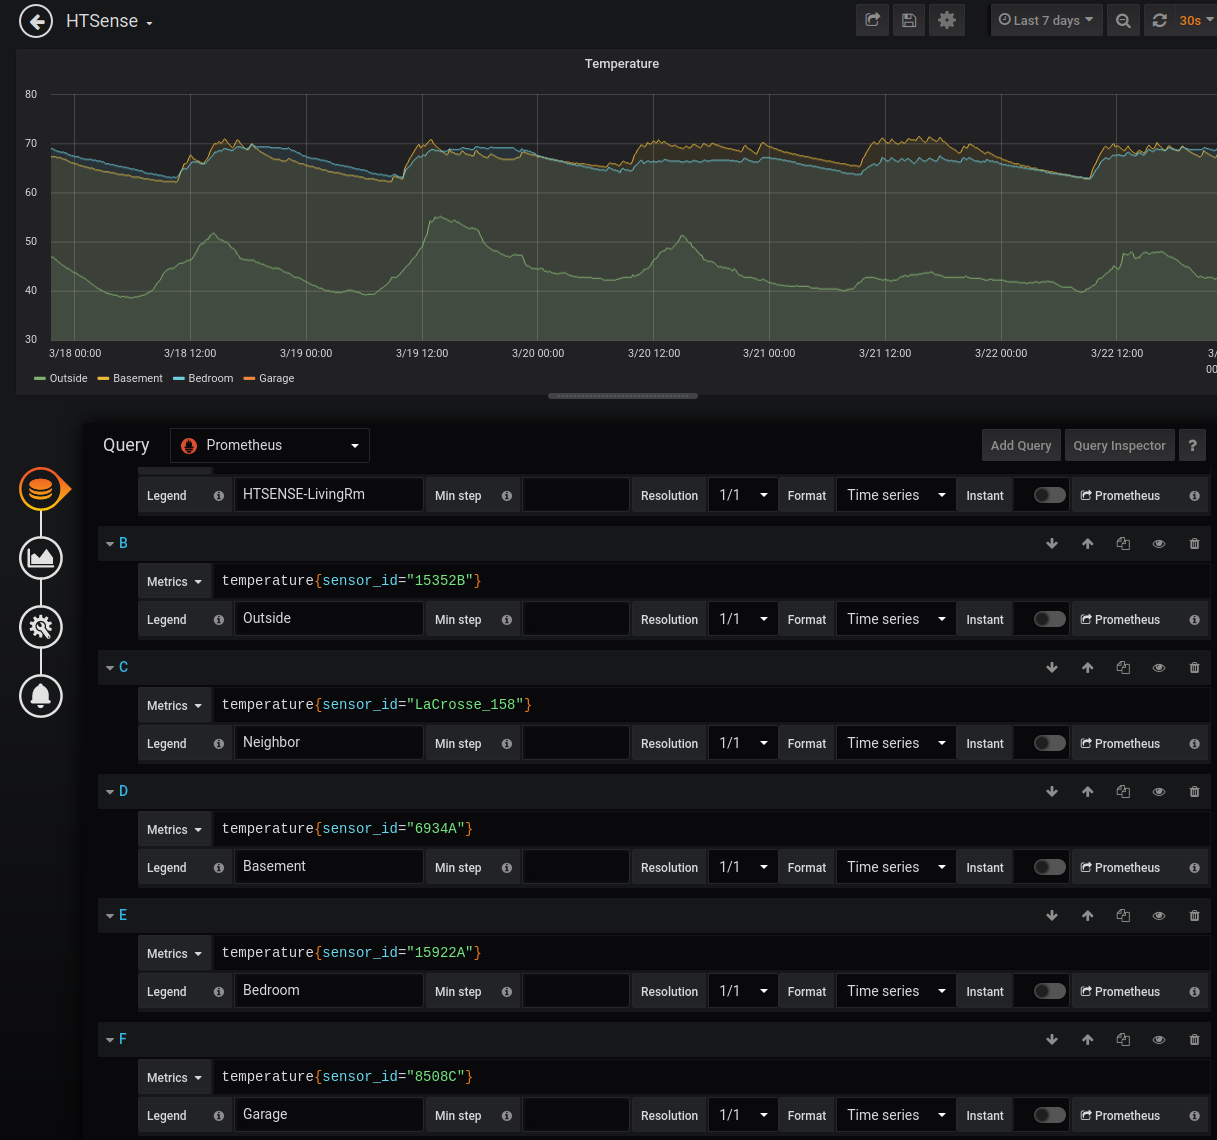
Grafana Setup
Now you can setup grafana dashboards with your incoming sensor info. Create plots, or guages, or whatever you prefer. In grafana, I label data sources accoring to where they are, e.g. "Garage" or "Bedroom". Here's a quick example of a configuration for a temperature plot:
Checkout the Grafana Docs for everything you can do.